

The data in Exhibit 11.3 on industry median betas suggest that firms in the following three sets
Question:
The data in Exhibit 11.3 on industry median betas suggest that firms in the following three sets of related industries have different degrees of systematic risk.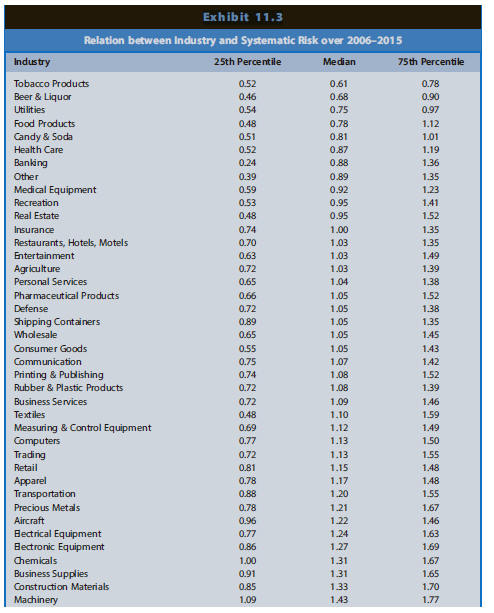
Median Beta during 2006-2015 Utilities versus Petroleum and Natural Gas 0.75 versus 1.45 Food Products (Grocery Stores) versus Apparel (Retailers) 0.78 versus 1.17 Banking (Depository Institutions) versus Trading (Financial Security and Commodity Brokers) 0.88 versus 1.13
REQUIREDa. For each matched pair of industries, describe factors that characterize a typical firm's business model in each industry. Describe how such factors would contribute to differences in systematic risk.b. For each matched pair of industries, use the CAPM to compute the required rate of return on equity capital for the median firm in each industry. Assume that the risk-free rate of return is 4.0% and the market risk premium is 5.0%.c. For each matched pair of industries, compute the present value of a stream of $1 dividends for the median firm in each industry. Use the perpetuity-with-growth model and assume 3.0% long-run growth for each industry. What effect does the difference in systematic risk across industries have on the per-dollar dividend valuation of the median firm in each industry?
DividendA dividend is a distribution of a portion of company’s earnings, decided and managed by the company’s board of directors, and paid to the shareholders. Dividends are given on the shares. It is a token reward paid to the shareholders for their...
Step by Step Answer:
a Utilities versus Petroleum and Natural Gas 075 versus 145 Both industries are engaged in the production of energy The typical utility firm is highly leveraged which would increase systematic risk bu...View the full answer


Financial Reporting Financial Statement Analysis and Valuation a strategic perspective
ISBN: 978-1337614689
9th edition
Authors: James M. Wahlen, Stephen P. Baginski, Mark Bradshaw
