

The Caribou Pipeline Company projects a pattern of inflows from the investment shown in the following table.
Question:
The Caribou Pipeline Company projects a pattern of inflows from the investment shown in the following table. The inflows are spread over time to reflect delayed benefits. Each year is independent of the others.
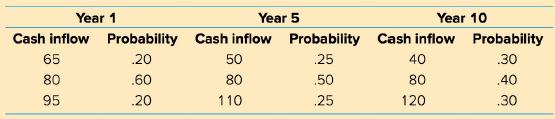
The expected value for all three years is $80.
a. Compute the standard deviation for each of the three years.
b. Diagram the expected values and standard deviations for each of the three years in a manner similar to Figure 13--6.
c. Assuming a 6 percent and 12 percent discount rate, complete the table for present value factors.
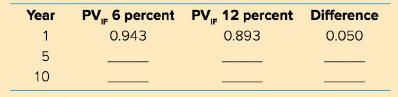
d. Is the increasing risk over time, as diagrammed in part b, consistent with the larger differences in PV,p-S over time as computed in part c?
e. Assume the initial investment is $135. What is the net present value of the expected values of $80 for the investment at a 12 percent discount rate? Should the investment be accepted?
Step by Step Answer:
a To compute the standard deviation for each year we need to use the formula for standard deviation of a discrete probability distribution Standard de...View the full answer


Foundations of Financial Management
ISBN: 978-1259024979
10th Canadian edition
Authors: Stanley Block, Geoffrey Hirt, Bartley Danielsen, Doug Short, Michael Perretta
