

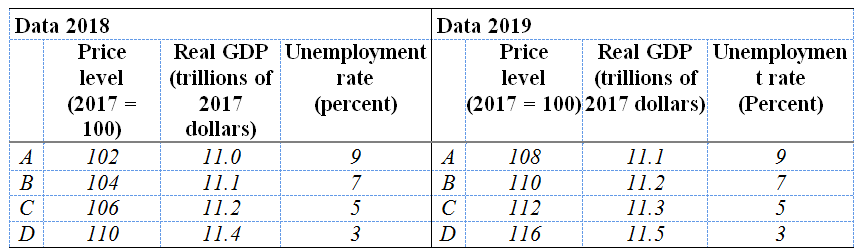
In 2019, the outcome turned out to be row C of the left side of the table.
Question:
The left part of the table describes four situations that might arise in 2018, depending on the level of aggregate demand. The right part of the table describes four situations that might arise in 2019.
Fantastic news! We've Found the answer you've been seeking!
Step by Step Answer:
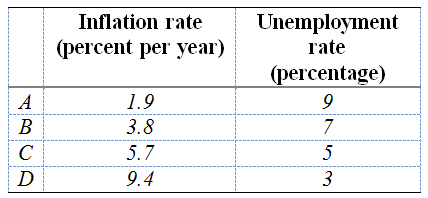
Use the table above to plot the Phillips curve The table and inflation rat...View the full answer

Answered By
Jinah Patricia Padilla
Had an experience as an external auditor in Ernst & Young Philippines and currently a Corporate Accountant in a consultancy company providing manpower to a 5-star hotel in Makati, Philippines, Makati Diamond Residences
120+ Reviews
150+ Question Solved
Related Book For 

Question Posted:
