

Drinkwater Inc. reported the following information: Other information: 1. No shares were issued during the years ended
Question:
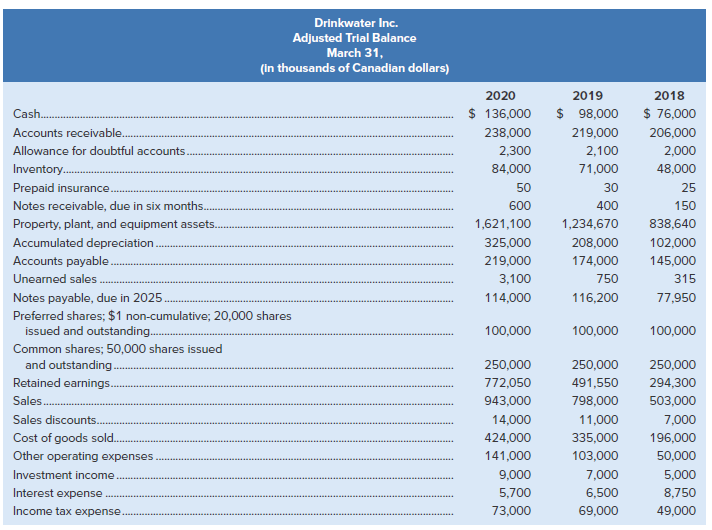
Drinkwater Inc. reported the following information:
Other information:
1. No shares were issued during the years ended March 31, 2020 and 2019.
2. No dividends were declared or paid during the years ended March 31, 2020 and 2019.
3. The market values per common share at March 31, 2020, and March 31, 2019, were $29 and $25, respectively.
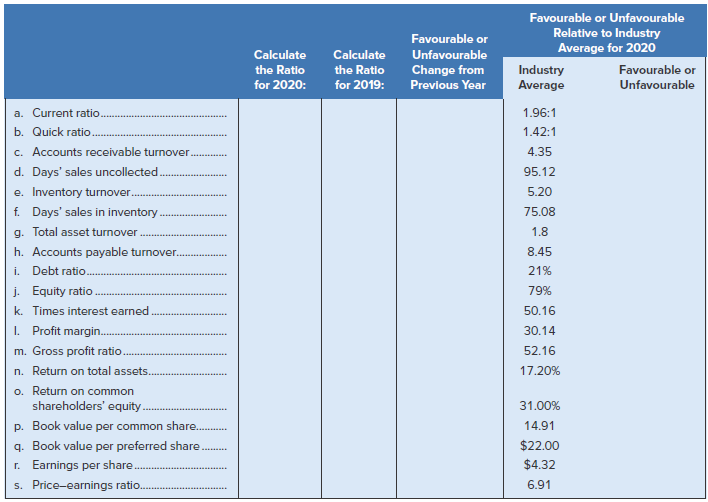
4. Industry averages for 2020 were as provided in the chart on the following page.
Required
1. Using the information provided for Drinkwater Inc., prepare a comparative, single-step income statement and statement of changes in equity for the years ended March 31, 2020 and 2019, as well as a comparative classified balance sheet at March 31, 2020 and 2019.
2. Complete the chart below for Drinkwater Inc. (round all ratios to two decimal places):
Balance sheet is a statement of the financial position of a business that list all the assets, liabilities, and owner’s equity and shareholder’s equity at a particular point of time. A balance sheet is also called as a “statement of financial...
Step by Step Answer:
1 DRINKWATER INC Income Statement For Year Ended March 31 2020 in thousands of Canadian dollars Revenues 2020 2019 Net sales 929000 787000 Investment income 9000 7000 Total revenues 938000 794000 Expe...View the full answer


Fundamental Accounting Principles Volume II
ISBN: 978-1260305838
16th Canadian edition
Authors: Kermit Larson, Tilly Jensen, Heidi Dieckmann
