

Following are five graphs representing various cost behaviors. (1) Identify whether the cost behavior in each graph
Question:
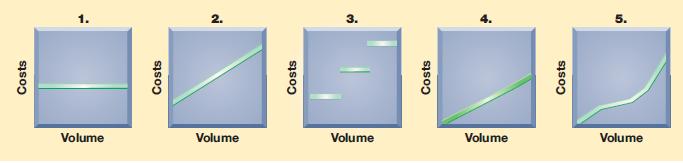
Following are five graphs representing various cost behaviors.
(1) Identify whether the cost behavior in each graph is mixed, step-wise, fixed, variable, or curvilinear.
(2) Identify the graph (by number) that best illustrates each cost behavior:
(a) Factory policy requires one supervisor for every 30 factory workers;
(b) real estate taxes on factory;
(c) electricity charge that includes the standard monthly charge plus a charge for each kilowatt hour;
(d) commissions to salespersons; and
(e) costs of hourly paid workers that provide substantial gains in efficiency when a few workers are added but gradually smaller gains in efficiency when more workers are added
Step by Step Answer:

This question has not been answered yet.
You can Ask your question!


Fundamental Accounting Principles
ISBN: 978-0078110870
20th Edition
Authors: John J. Wild, Ken W. Shaw, Barbara Chiappetta
