

Vertical analysis (common size) percentages for Dagman Companys sales revenue, cost of goods sold, and expenses are
Question:
Vertical analysis (common size) percentages for Dagman Company’s sales revenue, cost of goods sold, and expenses are shown below.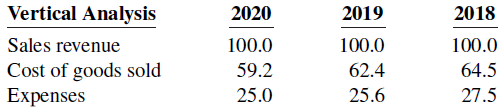
Did Dagman’s net income as a percentage of sales increase, decrease, or remain unchanged over the 3-year period? Provide numerical support for your answer.
Fantastic news! We've Found the answer you've been seeking!
Step by Step Answer:
2020 2019 2018 Sales revenue Cost of goods sold Expenses Ne...View the full answer

Answered By
Muhammad adeel
I am a professional Process/Mechanical engineer having a vast 7 years experience in process industry as well as in academic studies as a instructor. Also equipped with Nebosh IGC and lead auditor (certified).
Having worked at top notch engineering firms, i possess abilities such as designing process equipment, maintaining data sheets, working on projects, technical biddings, designing PFD and PID's etc.
Having worked as an instructor in different engineering institutes and have been involved in different engineering resrearch projects such as refinery equipment designing, thermodynamics, fluid dynamics, chemistry, rotary equipment etc
I can assure a good job within your budget and time deadline
52+ Reviews
60+ Question Solved
Related Book For 

Accounting Principles
ISBN: 978-1119419617
IFRS global edition
Authors: Paul D Kimmel, Donald E Kieso Jerry J Weygandt
Question Posted:
