

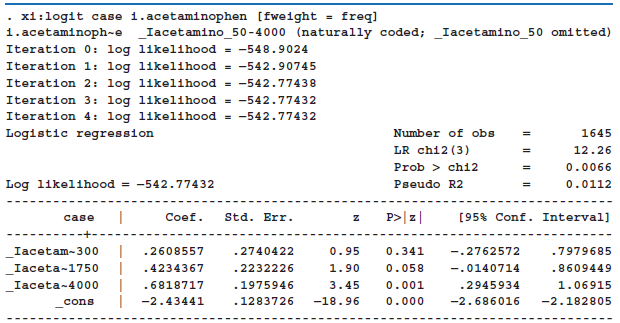
Estimate the odds ratio for Group C vs. Group A and provide a 95% CI. Are the
Question:
One assumption in Table 13.46 is that the log odds ratio of being a case is a linear function of the lifetime acetaminophen intake. To check this assumption, a second logistic regression was run relating disease status to acetaminophen intake in categories using the categories in Table 13.45 with Group A as the reference and Groups B, C, and D denoted by .Iacetam ~300, .Iacetam ~1750, .Iacetam ~4000, respectively (see Table 13.47).
Table 13.46: Logistic Regression relating decrease in GFR of ‰¥ 30% over 11 years vs. lifetime acetaminophen intake/100 (continuous variable)
![logit case ace_100 [fweight=freq] Iteration 0: log likelihood = -548.9024 Iteration 1: log likelihood = -543.33838 Itera](https://dsd5zvtm8ll6.cloudfront.net/si.question.images/images/question_images/1526/5/4/3/3325afd33e492d821526543320041.jpg)
Table 13.47: Logistic Regression relating decrease in GFR of ‰¥ 30% over 11 years vs. lifetime acetaminophen intake (categories)
Fantastic news! We've Found the answer you've been seeking!
Step by Step Answer:
From Table 1347 the estimated OR for group C versus group A is ...View the full answer

Answered By
Brown Arianne
Detail-oriented professional tutor with a solid 10 years of experience instilling confidence in high school and college students. Dedicated to empowering all students with constructive feedback and practical test-taking strategies. Effective educator and team player whether working in a school, university, or private provider setting. Active listener committed to helping students overcome academic challenges to reach personal goals.
2+ Reviews
10+ Question Solved
Related Book For 

Question Posted:
