

A firm wishes to estimate graphically the betas for two assets, A and B. It has gathered
Question:
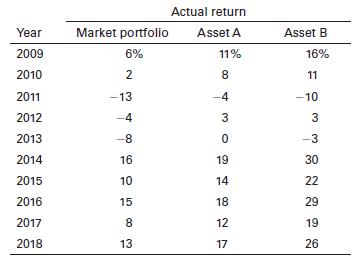
A firm wishes to estimate graphically the betas for two assets, A and B. It has gathered the return data shown in the following table for the market portfolio and for both assets over the past 10 years, 2009–2018.
In any of the possible two-stock portfolios, the weight of each stock in the portfolio will be 50%. The three possible portfolio combinations are AB, AC, and BC.
a. Calculate the average return for each individual stock.
b. Calculate the standard deviation for each individual stock.
c. Calculate the average returns for portfolios AB, AC, and BC.
d. Calculate the standard deviations for portfolios AB, AC, and BC.
e. Would you recommend that Jane invest in the single stock A or the portfolio consisting of stocks A and B? Explain your answer from a risk–return viewpoint.
f. Would you recommend that Jane invest in the single stock B or the portfolio consisting of stocks B and C? Explain your answer from a risk–return viewpoint.
Step by Step Answer:
Answer a The average return for stock A is 52 for stock B is 83 and for the m...View the full answer


Fundamentals Of Investing
ISBN: 9780135175217
14th Edition
Authors: Scott B. Smart, Lawrence J. Gitman, Michael D. Joehnk
