

Refer back to the annual returns for Consolidated Edison and Central Valley Bancorp in Problem 5.12. Following
Question:
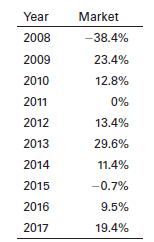
Refer back to the annual returns for Consolidated Edison and Central Valley Bancorp in Problem 5.12. Following are the annual returns on a broad market index from 2008 to 2017.
a. On a set of market return (x-axis)–investment return (y-axis) axes, use the data to draw the characteristic lines for ED and CVCY on the same graph.
b. Use the characteristic lines from part a to estimate the betas for the stocks.
c. Use the betas found in part b to comment on the relative risks of the two stocks.
Data From Problem 5.12
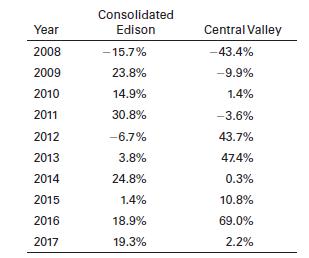
The following table contains annual returns from 2008 to 2017 for two stocks, Consolidated Edison (ED) and Central Valley Community Bancorp (CVCY). Use Excel to create a spreadsheet that calculates the average return, standard deviation, and correlation coefficient for the two stocks. Just comparing the two stocks in isolation, does one seem more attractive than the other? Next, calculate the average return and standard deviation for several portfolios, starting with one that invests 100% in ED and 0% in CVCY, then decreasing the percent invested in ED and increasing the investment in CVCY in 10% increments until you reach a portfolio with 0% ED and 100% CVCY (that would be 11 portfolios total). Draw a graph showing the standard deviation (x-axis) and the average return (y-axis) for each portfolio. What lesson does this exercise illustrate?
Step by Step Answer:
a b The beta for ED is 040 for CVCY it is 100 c When students plot the c...View the full answer


Fundamentals Of Investing
ISBN: 9780135175217
14th Edition
Authors: Scott B. Smart, Lawrence J. Gitman, Michael D. Joehnk
