

Refer to Exercise 8-36. Set up 2 control limits. What is the probability of detecting a change
Question:
Refer to Exercise 8-36. Set up 2σ control limits. What is the probability of detecting a change in the process average number of dietary errors per 100 trays to 8 on the first sample drawn after the change? Explain under what conditions you would prefer to have these 2σ control limits over the traditional 3σ limits.
Exercise 8-36
Refer to Exercise 8-27. Construct an OC curve for the c-chart. If the process average number of dietary errors per 100 trays increases to 10, what is the probability of detecting this on the first sample drawn after the change?
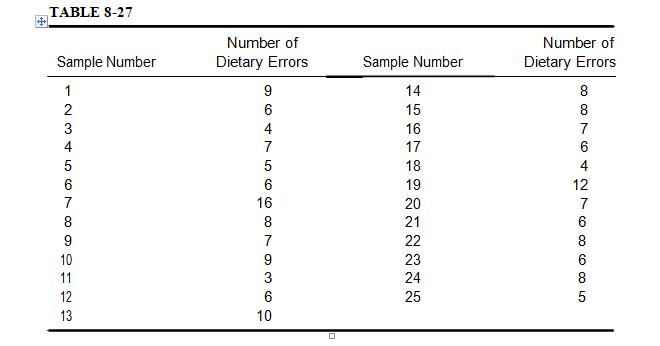
The number of dietary errors is found from a random sample of 100 trays chosen on a daily basis in a health care facility. The data for 25 such samples are shown in Table 8-27.
Table 8-27
- (a) Construct an appropriate control chart and comment on the process.
- (b) How many dietary errors do you predict if no changes are made in the process
(c) Is the system capable of reducing dietary errors to 2, on average, per 100 trays, if no changes are made in the process?
- (d) Is the system capable of reducing dietary errors to 2, on average, per 100 trays, if no changes are made in the process?
Step by Step Answer:
To set up 2 control limits for the cchart we first need to calculate the average number of dietary e...View the full answer


Fundamentals Of Quality Control And Improvement
ISBN: 9781118705148
4th Edition
Authors: Amitava Mitra
