

Table 3-1(14-1) in the text shows the percentage undervaluation or overvaluation in the Big Mac, based on
Question:
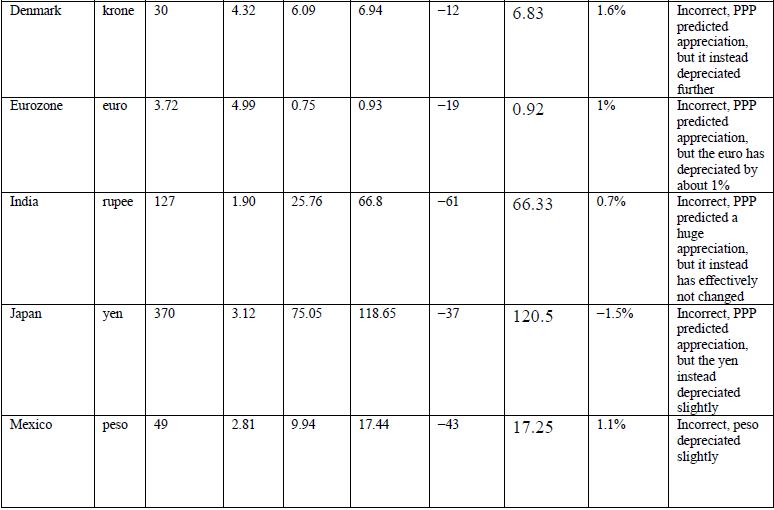
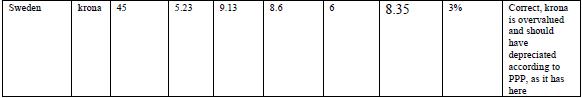
Table 3-1(14-1) in the text shows the percentage undervaluation or overvaluation in the Big Mac, based on exchange rates in January 2016. The table that follows shows the local currency price as well as the U.S. dollar price for the previous year in January 2015. Suppose purchasing power parity holds in the long run, so that these deviations would be expected to disappear. Suppose the local currency prices of the Big Mac remained unchanged. Exchange rates on January 4, 2016, were as follows (Data from: IMF):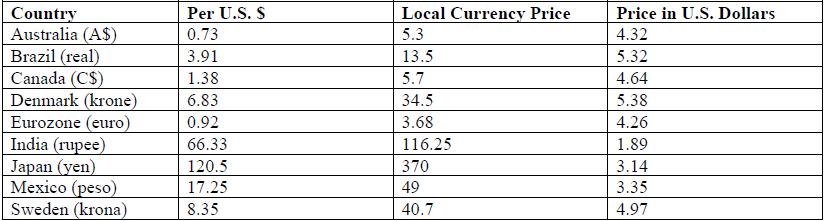
Based on these data and Table 3-1(14-1), calculate the change in the exchange rate from 2015 to 2016, and state whether the direction of change was consistent with the PPP-implied exchange rate using the Big Mac Index. How might you explain the failure of the Big Mac Index to correctly predict the change in the nominal exchange rate between January 2015 and January 2016?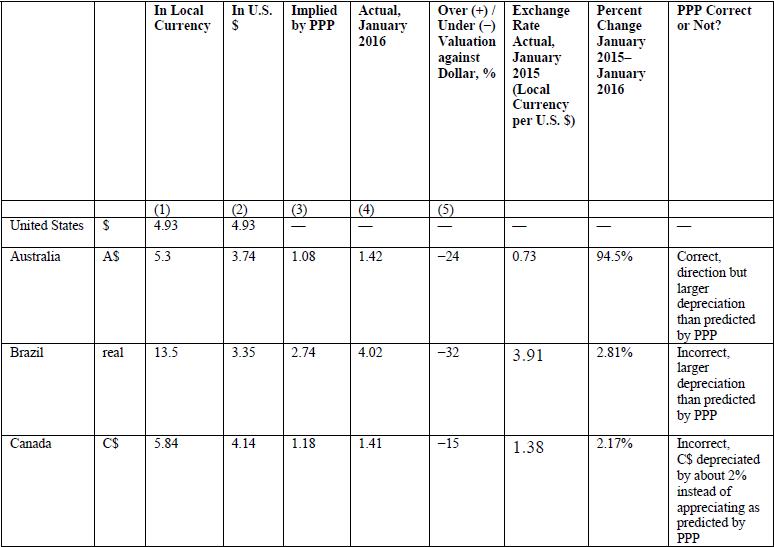
Step by Step Answer:
We can see from the table that during this time PPP could be used ...View the full answer


International Macroeconomics
ISBN: 9781319218423
5th Edition
Authors: Robert C. Feenstra, Alan M. Taylor
