

A student resampled the Maze times from Exercise 55 1000 times. The histogram shows the distributions of
Question:
A student resampled the Maze times from Exercise 55 1000 times. The histogram shows the distributions of the means, and a summary of the quantiles is shown below it.
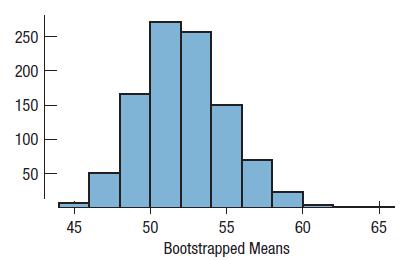
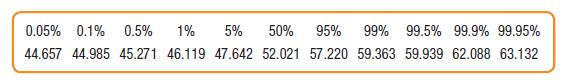
a) Find a 99% bootstrap confidence interval for the true mean time it takes to complete the maze.
b) Why is the sampling distribution slightly skewed to the right?
c) How does the skewness affect the confidence interval?
d) What does the confidence interval say about the hypothesis that it takes a minute on average?
Fantastic news! We've Found the answer you've been seeking!
Step by Step Answer:
a To find the 99 bootstrap confidence interval use th...View the full answer

Answered By
Carly Cimino
As a tutor, my focus is to help communicate and break down difficult concepts in a way that allows students greater accessibility and comprehension to their course material. I love helping others develop a sense of personal confidence and curiosity, and I'm looking forward to the chance to interact and work with you professionally and better your academic grades.
12+ Reviews
21+ Question Solved
Related Book For 

Intro Stats
ISBN: 9780134668420
5th Edition
Authors: Richard D De Veaux, Paul F Velleman, David E Bock, Nick Horton
Question Posted:
