

1. Complete the master schedule for Product X, including the projected available inventory and the ATP numbers....
Question:
1. Complete the master schedule for Product X, including the projected available inventory and the ATP numbers.
2. From the master schedule for Product X and using the data given for components A, B, C, and D, create MRP grids for each of the components for the next ten weeks.
3. Suppose that a customer for Product X wants three additional units for their order scheduled for week 4. What would you tell them? Specifically, if you cannot promise them the three units for week 4, what is the best that you can do given the information you have. Assume that adequate capacity exists in all the production equipment.
4. The customer described in question 3 decides against placing the order for the extra units in week 4, but shortly thereafter you are informed that someone in the warehouse dropped a box of component C and broke 20 of them. They had to be scrapped. Describe the consequences and a plan of action to deal with the problem. Assume the lead time for component C is a firm 2 weeks.
5. It is clear that the company has set the safety stock (planning for extra material ?just in case? something goes wrong) level for components at zero in order to minimize their inventory during the slow season. Discuss this policy, pointing out the pros and cons of such a policy. Develop what you might suggest as a policy for safety stock given the information available in the case.
Benzie Products Company produces several lines of products, but one (they call it ?product X?) uses unique parts to produce it and the demand is very seasonal. There are some possible variations in the design, so the company tends to use available-to-promise (ATP) logic to master schedule the product. Since the components to produce it are quite expensive, the company tries very hard to minimize any inventory of the product or its components during the seasons with very low sales. Product X is just now entering the low season, and the following chart represents the forecast data and actual customer orders for the next ten weeks:
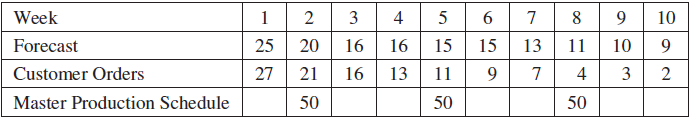
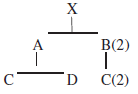
There are currently (at the start of week 1) 27 product X left in inventory. The following represents the product structure for product X:
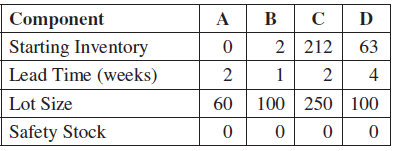
The following table gives the relevant data for components A, B, C, and D at the start of week 1:
Step by Step Answer:
Projected onhand after MPS Previous week Inventory MPS Week Requirements Where week requirement maximum forecast Orders Available to promise ATP For w...View the full answer


Introduction To Materials Management
ISBN: 978-9386873248
8th edition
Authors: Arnold J. R. Tony, Gatewood Ann K., M. Clive Lloyd N. Chapman Stephen
