

1. Perform a test of homogeneity for each question and verify the reported p-value of the test....
Question:
2. Questions 3, 4, and 7 are concerned with the atmosphere of the library; questions 5 and 6 are concerned with the library staff; and questions 11 and 13 are concerned with the library design. How would you summarize the results of your analyses regarding these seven questions concerning the image of the library?
3. With the information given, is it possible to do any further testing concerning the proportion of favorable versus unfavorable responses for two or more questions simultaneously?
Carole Day and Del Lowenthal studied the responses of young adults in their evaluation of library services. Of the n = 200 young adults involved in the study, n1 = 152 were students and n2 = 48 were nonstudents. The table presents the percents and numbers of favorable responses for each group to seven questions in which the atmosphere, staff, and design of the library were examined.
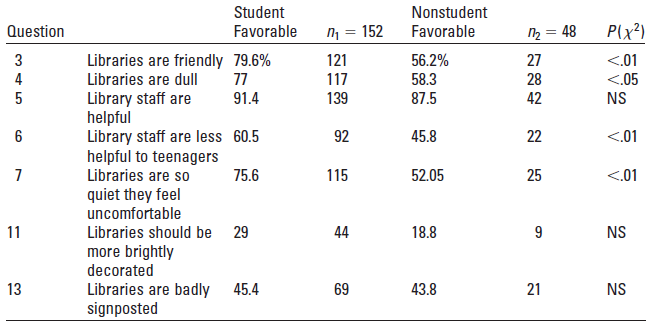
The entry in the last column labeled P(x2) is the p-value for testing the hypothesis of no difference in the proportion of students and nonstudents who answer each question favorably. Hence, each question gives rise to a 2 × 2 contingency table.
Step by Step Answer:
1 There are seven different 2 2 contingency tables to test the null hypothesis H 0 p 1 p 2 for each ...View the full answer


Introduction To Probability And Statistics
ISBN: 9780495389538
13th Edition
Authors: William Mendenhall, Robert J. Beaver, Barbara M. Beaver
