

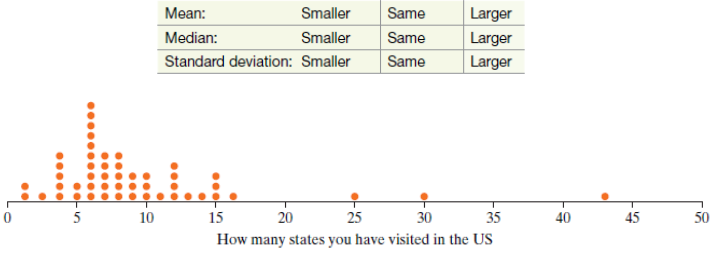
An instructor collected data on the number of states students in her class have visited in the
Question:
a. Identify the observational units.
b. Identify the variable recorded and whether it is categorical or quantitative.
c. Describe what the graph tells us about distribution of the variable recorded. Be sure to comment on shape, center, and variability.
d. Use the dotplot to find and report the median value for the number of states visited by the students in this study.
e. Would the mean value for these data be smaller than, larger than, or the same as the median, as reported in (d)? Explain your reasoning.
f. Suppose that the observation recorded as 43 states is a typo and was meant to be 34. If we corrected this entry in the data set, how would the following numerical statistics change, if at all?
The word "distribution" has several meanings in the financial world, most of them pertaining to the payment of assets from a fund, account, or individual security to an investor or beneficiary. Retirement account distributions are among the most...
Fantastic news! We've Found the answer you've been seeking!
Step by Step Answer:
a The students in the class b The variable is the number of states visited and i...View the full answer

Answered By
Qasim Ali
“Hello, I'm Qasim! I have been tutoring for 5 years now and it's truly been one of the most rewarding experiences of my life. I've helped so many students achieve their academic goals year after year and I know that You are more than capable of doing the same with the right help. I received my degree in Business Administration and specialize in the areas of Accounting and Finance for high school and college students.”
0 Reviews
10+ Question Solved
Related Book For 

Introduction To Statistical Investigations
ISBN: 9781118172148
1st Edition
Authors: Beth L.Chance, George W.Cobb, Allan J.Rossman Nathan Tintle, Todd Swanson Soma Roy
Question Posted:
