

For the period 19901999, the Bristol-Myers Squibb Company, Inc. reported the following amounts (in billions of dollars)
Question:
(1) Net sales and
(2) Advertising and product promotion. The data are also in the file XR02062.
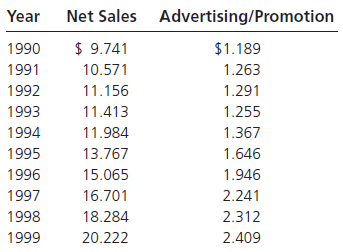
For these data, construct a line graph that shows both net sales and expenditures for advertising/product promotion over time. Some would suggest that increases in advertising should be accompanied by increases in sales. Do your line graphs seem to support this?
Fantastic news! We've Found the answer you've been seeking!
Step by Step Answer:
The Excel chart weakly supports the claim that increases in advertisin...View the full answer

Answered By
Shem Ongek
I am a professional who has the highest levels of self-motivation. Additionally, I am always angled at ensuring that my clients get the best of the quality work possible within the deadline. Additionally, I write high quality business papers, generate quality feedback with more focus being on the accounting analysis. I additionally have helped various students here in the past with their research papers which made them move from the C grade to an A-grade. You can trust me 100% with your work and for sure I will handle your papers as if it were my assignment. That is the kind of professionalism that I swore to operate within. I think when rating the quality of my work, 98% of the students I work for always come back with more work which therefore makes me to be just the right person to handle your paper.
174+ Reviews
426+ Question Solved
Related Book For 

Question Posted:
