

In 2004, unemployment rates in the 50 U.S. states were reported as follows. These data are also
Question:
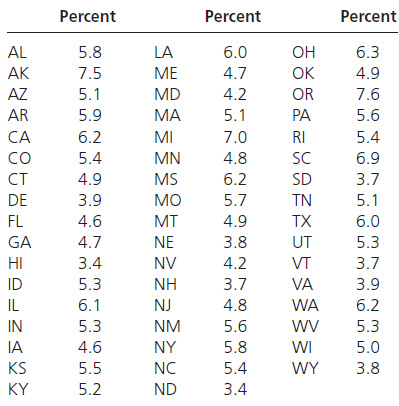
a. Construct a stem-and-leaf display for these data.
b. Construct a frequency distribution for these data.
c. Determine the interval width and the class mark for each of the classes in your frequency distribution.
d. Based on the frequency distribution obtained in part (b), draw a histogram and a relative frequency polygon to describe the data.
The word "distribution" has several meanings in the financial world, most of them pertaining to the payment of assets from a fund, account, or individual security to an investor or beneficiary. Retirement account distributions are among the most...
Fantastic news! We've Found the answer you've been seeking!
Step by Step Answer:
a Stemandleaf display StemandLeaf Display Unemp Steman...View the full answer

Answered By
Lamya S
Highly creative, resourceful and dedicated High School Teacher with a good fluency in English (IELTS- 7.5 band scorer) and an excellent record of successful classroom presentations.
I have more than 2 years experience in tutoring students especially by using my note making strategies.
Especially adept at teaching methods of business functions and management through a positive, and flexible teaching style with the willingness to work beyond the call of duty.
Committed to ongoing professional development and spreading the knowledge within myself to the blooming ones to make them fly with a colorful wing of future.
I do always believe that more than being a teacher who teaches students subjects,...i rather want to be a teacher who wants to teach students how to love learning..
Subjects i handle :
Business studies
Management studies
Operations Management
Organisational Behaviour
Change Management
Research Methodology
Strategy Management
Economics
Human Resource Management
Performance Management
Training
International Business
Business Ethics
Business Communication
Things you can expect from me :
- A clear cut answer
- A detailed conceptual way of explanation
- Simplified answer form of complex topics
- Diagrams and examples filled answers
46+ Reviews
54+ Question Solved
Related Book For 
Question Posted:
