

In a survey of introductory statistics students, an instructor asked her students to report how many Facebook
Question:
a. Identify whether the study is an experiment or an observational study. Explain.
b. Identify the observational units.
c. Identify the explanatory and response variables. Also, for each variable identify whether it is categorical or quantitative.
d. Which of the following is the appropriate null hypothesis? Circle one.
A. There is an association between a person€™s sex and the number of Facebook friends.
B. Th ere is no association between a person€™s sex and the number of Facebook friends.
C. On average, men have more Facebook friends than women.
D. On average, men have fewer Facebook friends than women.
e. Which of the following is the appropriate alternative hypothesis? Circle one.
A. There is an association between a person€™s sex and the number of Facebook friends.
B. Th ere is no association between a person€™s sex and the number of Facebook friends.
C. On average, men have more Facebook friends than women.
D. On average, men have fewer Facebook friends than women.
Here are a few summary statistics about the data:
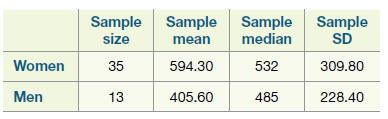
f. In this context, which of the following is an (are) appropriate statistic value(s) to compare men to women? Circle all that apply.
A. 35 ˆ’ 13 = 22
B. 594.30 ˆ’ 405.60 = 188.70
C. 532 ˆ’ 485 = 47
D. 309.80 ˆ’ 228.40 = 81.40
Suppose that we want to use cards to carry out a randomization test of the appropriate hypotheses.
g. How many cards will we need? Circle one.
A. 35
B. 13
C. 48
D. Doesn€™t matter
The following is output from carrying out the randomization test using the Multiple Means applet.
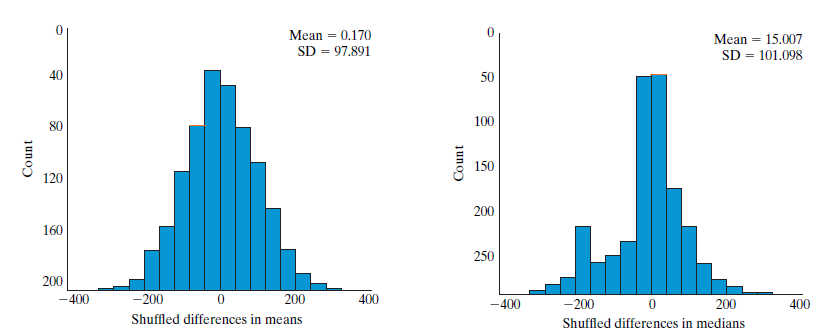
h. On the histogram above, shade the region that depicts the p-value.
Step by Step Answer:
a Observational study there is no randomization of t...View the full answer


Introduction To Statistical Investigations
ISBN: 9781118172148
1st Edition
Authors: Beth L.Chance, George W.Cobb, Allan J.Rossman Nathan Tintle, Todd Swanson Soma Roy
