

Recall from Exercise P.2.5 the data on duration of NFL football games in 2012 for the first
Question:
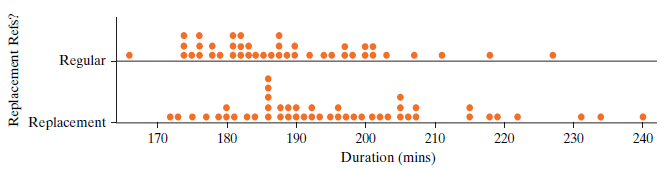
a. Identify the observational units and variables in this graph. Also identify which variable is explanatory and which is response and classify the variables as categorical or quantitative.
b. Did the data collection for this study make use of random sampling, random assignment, or neither? Explain.
c. Before you conduct an inferential analysis, what do the dotplots suggest with regard to the question of whether game durations differed for the two types of referees?
d. State the appropriate hypotheses for testing whether the long-run average game duration is different for games played with replacement referees as compared to games played with regular referees.
e. Use an applet to simulate a randomization test for testing the hypotheses in part (d) and find the p-value.
f. Interpret what this p-value means in this context.
g. Use the simulation results to produce a 95% confidence interval for the relevant parameter.
h. Interpret this confidence interval.
i. Summarize your conclusions from these data. Make sure you address significance, confidence, generalization, and causation.
Fantastic news! We've Found the answer you've been seeking!
Step by Step Answer:
a Each game is an observational unit The variables are explanatory categorical regular vs replacemen...View the full answer

Answered By
Asd fgh
sadasmdna,smdna,smdna,msdn,masdn,masnd,masnd,m asd.as,dmas,dma.,sd as.dmas.,dma.,s ma.,sdm.,as mda.,smd.,asmd.,asmd.,asmd.,asm
1+ Reviews
15+ Question Solved
Related Book For 

Introduction To Statistical Investigations
ISBN: 9781118172148
1st Edition
Authors: Beth L.Chance, George W.Cobb, Allan J.Rossman Nathan Tintle, Todd Swanson Soma Roy
Question Posted:
