

Recall the previous exercise, which described the Italian firm Ma-Vib that was in the news for sexual
Question:
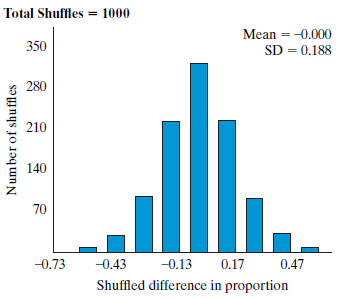
a. The graph is a histogram of 1,000 possible values of difference in dismissals between men and women. At what numeric value does this graph center? Explain why that makes sense.
b. What value should be entered in the box next to €œBeyond€?
c. Estimate and report the p-value from the graph. Also, shade the region of the graph that represents the p-value.
d. Based on the p-value reported in part (c), would it be okay to say that the proportion of women fi red by Ma-Vib was significantly higher than that of men? How are you deciding?
e. Based on your findings above, would it be okay to say that Ma-Vib fired the 15 women because they were women? How are you deciding?
f. Explain why it does not make sense to calculate a confidence interval is this context. (Hint: What would the confidence interval be estimating?)
Step by Step Answer:
a 0 because if the null hypothesis is true there is no diff...View the full answer


Introduction To Statistical Investigations
ISBN: 9781118172148
1st Edition
Authors: Beth L.Chance, George W.Cobb, Allan J.Rossman Nathan Tintle, Todd Swanson Soma Roy
