

Reconsider the data in the previous question about number of hours spent studying. a. Find the median
Question:
a. Find the median number of study hours for both males and females. What do these numbers tell us about the two data sets?
b. Find the inter-quartile range for the number of study hours for both males and females. What do these numbers tell us about the two data sets?
c. Construct parallel boxplots by hand for the two data sets.
Data from previous question
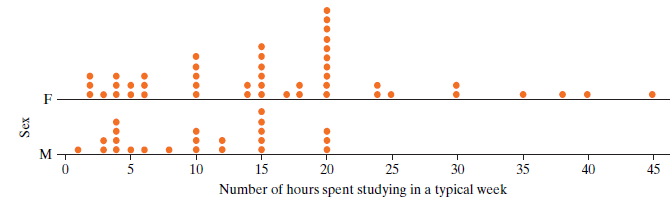
In a survey of introductory statistics students, an instructor asked students to report how many hours they had spent studying in a typical week during the last term and their sex. The data appears in the 6.1.15 dotplot. Describe what the graph tells us about any similarities and differences between men and women when it comes to how much time they report spending studying every week. Be sure to compare and contrast the shape, center, and spread for study hours€™ distributions for males and females.
Fantastic news! We've Found the answer you've been seeking!
Step by Step Answer:
a Males 10 females 15 Females tend to study more th...View the full answer

Answered By
Muhammad Umair
I have done job as Embedded System Engineer for just four months but after it i have decided to open my own lab and to work on projects that i can launch my own product in market. I work on different softwares like Proteus, Mikroc to program Embedded Systems. My basic work is on Embedded Systems. I have skills in Autocad, Proteus, C++, C programming and i love to share these skills to other to enhance my knowledge too.
1+ Reviews
10+ Question Solved
Related Book For 

Introduction To Statistical Investigations
ISBN: 9781118172148
1st Edition
Authors: Beth L.Chance, George W.Cobb, Allan J.Rossman Nathan Tintle, Todd Swanson Soma Roy
Question Posted:
