

Reconsider the previous two exercises. Answer the following based on the scatterplot presented above. Do not bother
Question:
a. Which cat has the largest predicted value for its takeoff velocity?
b. Which cat has the smallest predicted value for its takeoff velocity?
c. Which cat has the largest residual value?
d. Which cat has the smallest residual value?
Data from previous exercises
Harris and Steudel (2002) studied factors that might be associated with the jumping performance of domestic cats. They studied 18 cats, using takeoff velocity (in centimeters per second) as the response variable. They used body mass (in grams), hind limb length (in centimeters), muscle mass (in grams), and percent body fat in addition to sex as potential explanatory variables. Th e data can be found in the CatJumping data file. A scatterplot of takeoff velocity vs. body mass is shown in the figure for Exercise 10.3.15.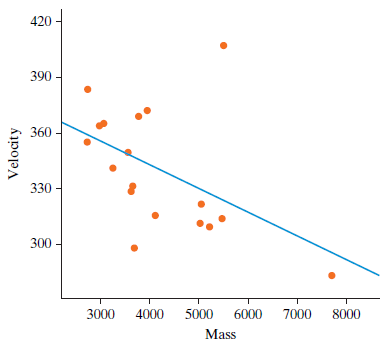
Fantastic news! We've Found the answer you've been seeking!
Step by Step Answer:
a The cat with body mass 266...View the full answer

Answered By
Larlyu mosoti
I am a professional writer willing to do several tasks free from plagiarism, grammatical errors and submit them in time. I love to do academic writing and client satisfaction is my priority. I am skilled in writing formats APA, MLA, Chicago, and Harvard I am a statistics scientist and I can help out in analyzing your data. I am okay with SPSS, EVIEWS, MS excel, and STATA data analyzing tools.
Statistical techniques: I can do linear regression, time series analysis, logistic regression, and some basic statistical calculations like probability distributions. . I'm ready for your working projects!
Services I would offer:
• Academic writing.
• Article writing.
• Data entry.
• PDF conversion.
• Word conversion
• Proofreading.
• Rewriting.
• Data analyzing.
The best reason to hire me:
- Professional and Unique work in writing.
- 100% satisfaction Guaranteed
- within required time Express delivery
- My work is plagiarism Free
- Great communication
My passion is to write vibrantly with dedication. I am loyal and confident to give my support to every client. Because Client satisfaction is much more important to me than the payment amount. A healthy client-contractor relationship benefits in the longer term. Simply inbox me if you want clean work.
3+ Reviews
10+ Question Solved
Related Book For 

Introduction To Statistical Investigations
ISBN: 9781118172148
1st Edition
Authors: Beth L.Chance, George W.Cobb, Allan J.Rossman Nathan Tintle, Todd Swanson Soma Roy
Question Posted:
