

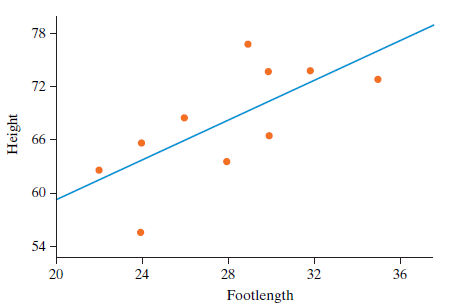
Suppose a sample of 10 people had their foot lengths (cm) and heights (inches) measured. The results,
Question:
Fantastic news! We've Found the answer you've been seeking!
Step by Step Answer:
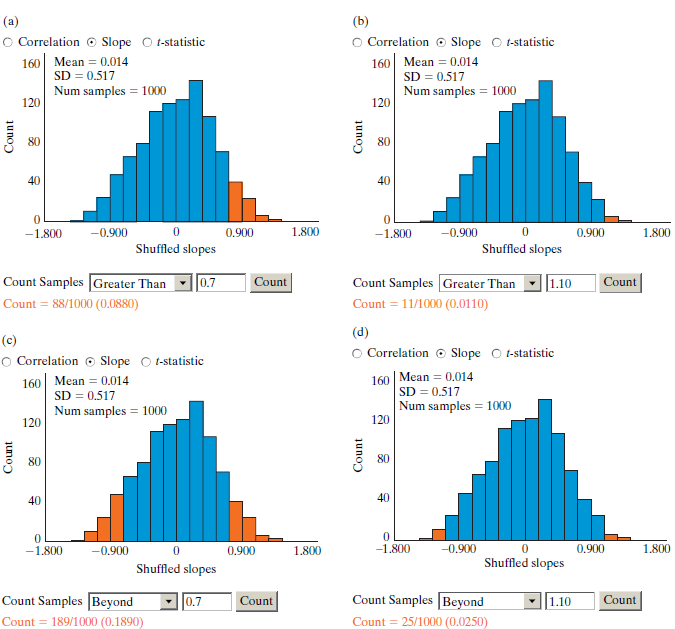
b O Correlation Count 160 Mean 0014 S...View the full answer

Answered By
Nandana Wijayarathna
I am a highly experienced writer in several areas,
Business management
Information technology
Business administration
Literature
Biology
Environmental science
History
161+ Reviews
399+ Question Solved
Related Book For 

Introduction To Statistical Investigations
ISBN: 9781118172148
1st Edition
Authors: Beth L.Chance, George W.Cobb, Allan J.Rossman Nathan Tintle, Todd Swanson Soma Roy
Question Posted:
