

The accompanying data show the U.S. population versus shipments of socks. a. Determine the least-squares regression line
Question:
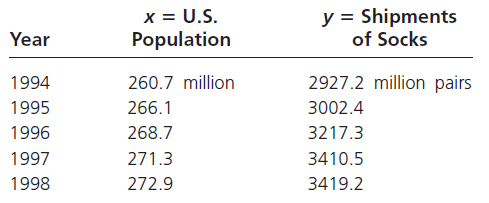
a. Determine the least-squares regression line and calculate r.
b. What proportion of the variability in sock shipments is explained by the regression equation?
c. During a year when the U.S. population is 280 million, estimate shipments for socks.
Fantastic news! We've Found the answer you've been seeking!
Step by Step Answer:
Use of the formulas and pocket calculator will be facilitated by the following summary of preliminar...View the full answer

Answered By
Utsab mitra
I have the expertise to deliver these subjects to college and higher-level students. The services would involve only solving assignments, homework help, and others.
I have experience in delivering these subjects for the last 6 years on a freelancing basis in different companies around the globe. I am CMA certified and CGMA UK. I have professional experience of 18 years in the industry involved in the manufacturing company and IT implementation experience of over 12 years.
I have delivered this help to students effortlessly, which is essential to give the students a good grade in their studies.
2+ Reviews
10+ Question Solved
Related Book For 
Question Posted:
