

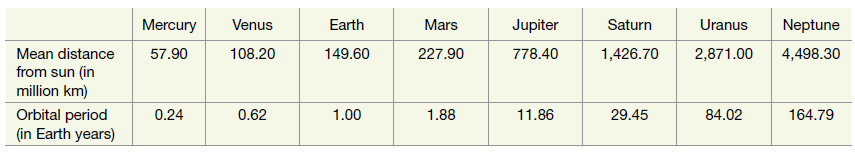
The following data shown in the table on the eight planets in our solar system were obtained
Question:
a. Describe the association between these variables as described in the graph on the scatterplot below. Comment on direction, strength, and form of the association.
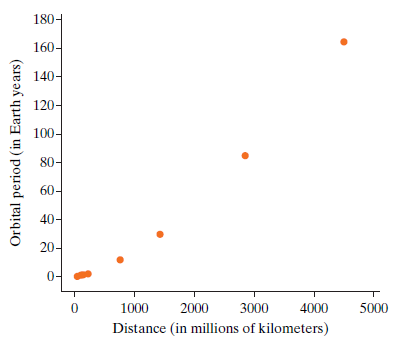
b. The correlation coefficient between these variables equals 0.988. Would you conclude that the relationship between these variables is linear? Explain.
Fantastic news! We've Found the answer you've been seeking!
Step by Step Answer:
a There is a strong positive fairly linear association betwe...View the full answer

Answered By
Collins Omondi
I have been an academic and content writer for at least 6 years, working on different academic fields including accounting, political science, technology, law, and nursing in addition to those earlier listed under my education background.
I have a Bachelor’s degree in Commerce (Accounting option), and vast knowledge in various academic fields Finance, Economics, Marketing, Management, Social Science, Women and Gender, Business law, and Statistics among others.
4+ Reviews
16+ Question Solved
Related Book For 

Introduction To Statistical Investigations
ISBN: 9781118172148
1st Edition
Authors: Beth L.Chance, George W.Cobb, Allan J.Rossman Nathan Tintle, Todd Swanson Soma Roy
Question Posted:
