

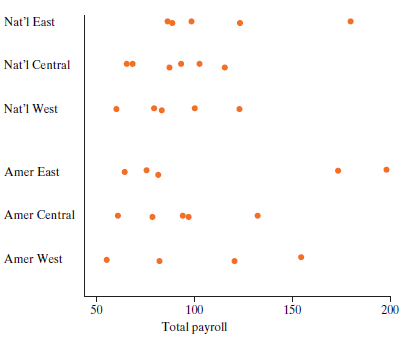
The plot shows total payroll in millions of dollars for the 30 major league teams of professional
Question:
a. Identify the observational units, the response, and the explanatory variable.
b. For plots like the one above:
i. Each point represents a _______ (unit, response value, value of the explanatory variable).
ii. Each horizontal cluster, taken as a whole, corresponds to a value of the _________ (response, explanatory) variable.
iii. Values along the horizontal axis represent values of the _________ (response, explanatory) variable.
c. The overall distribution of the response is (choose one):
A. Symmetric
B. Skewed right (a long tail points to the larger values)
C. Skewed left (a long tail points to the lower values)
D. No way to tell; need to see a histogram
d. Comparing groups by eye suggests that (choose one):
A. Group means are roughly equal. A p-value will show weak evidence of differences between group means.
B. Group means show substantial differences, but total payroll varies a lot within divisions. A p-value will not show strong evidence of group differences in means.
C. Group means are roughly equal, but within-group variability is small enough that with several response values per group even the small differences in means will register as significant.
D. Group means show substantial differences, and overall variability within divisions is small enough by comparison to differences in group means that a p-value will show evidence, possibly strong evidence, of differences.
E. There is no way to tell without getting a computer to find the p-values.
Baseball payrolls*
The word "distribution" has several meanings in the financial world, most of them pertaining to the payment of assets from a fund, account, or individual security to an investor or beneficiary. Retirement account distributions are among the most...
Fantastic news! We've Found the answer you've been seeking!
Step by Step Answer:
a The observational units are the teams the response is the t...View the full answer

Answered By
JAPHETH KOGEI
Hi there. I'm here to assist you to score the highest marks on your assignments and homework. My areas of specialisation are:
Auditing, Financial Accounting, Macroeconomics, Monetary-economics, Business-administration, Advanced-accounting, Corporate Finance, Professional-accounting-ethics, Corporate governance, Financial-risk-analysis, Financial-budgeting, Corporate-social-responsibility, Statistics, Business management, logic, Critical thinking,
So, I look forward to helping you solve your academic problem.
I enjoy teaching and tutoring university and high school students. During my free time, I also read books on motivation, leadership, comedy, emotional intelligence, critical thinking, nature, human nature, innovation, persuasion, performance, negotiations, goals, power, time management, wealth, debates, sales, and finance. Additionally, I am a panellist on an FM radio program on Sunday mornings where we discuss current affairs.
I travel three times a year either to the USA, Europe and around Africa.
As a university student in the USA, I enjoyed interacting with people from different cultures and ethnic groups. Together with friends, we travelled widely in the USA and in Europe (UK, France, Denmark, Germany, Turkey, etc).
So, I look forward to tutoring you. I believe that it will be exciting to meet them.
2+ Reviews
10+ Question Solved
Related Book For 

Introduction To Statistical Investigations
ISBN: 9781118172148
1st Edition
Authors: Beth L.Chance, George W.Cobb, Allan J.Rossman Nathan Tintle, Todd Swanson Soma Roy
Question Posted:
