The U.S. Census Bureau classifies the 50 U.S. states into four regions: Northeast (9 states, New England
Question:
Northeast (9 states, New England and Middle Atlantic):
CT, ME, MA, NH, NJ, NY, PA, RI, VT
South (16 states, South Atlantic, East South Central, and West South Central):
AL, AR, DE, FL, GA, KY, LA, MD, MS, NC, OK, SC, TN, TX, VA, WV
Midwest (12 states, East North Central and West North Central):
IL, IN, IA, KS, MI, MN, MO, NE, ND, OH, SD, WI
West (12 states, Mountain and Pacifi c):
AK, AZ, CA, CO, HI, ID, MT, NV, MN, OR, UT, WA
(When the District of Columbia (D.C.) is included, it is part of the South.)
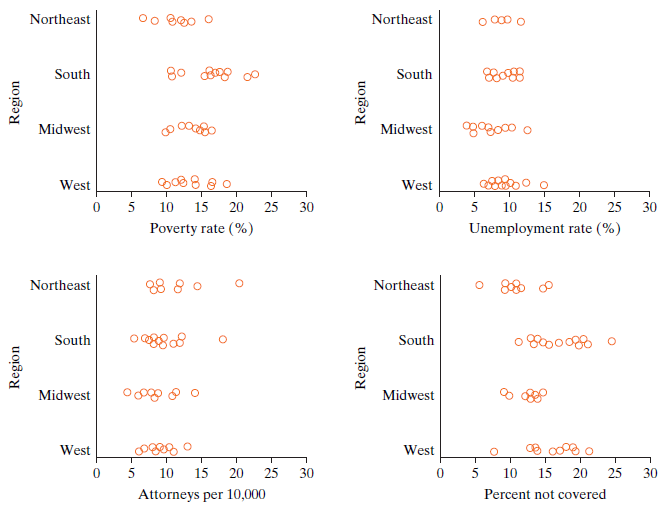
a. The graph for Exercise 9.CE.17 shows dotplots by region for four different response variables. For these four data sets, the response differs, but the observational unit and the explanatory variable are always the same. What is the observational unit? What is the explanatory variable?
b. Two of the overall means (all 50 states) are between 8 and 9, and two are between 13 and 14. Which is which? The horizontal scales are the same for each plot.
c. Here are four pairs of group means for the Northeast and the West: (8.5, 9.3), (11.9, 8.9), (11.2, 13.8), (11.0, 16.8). Which pair goes with which response variable?
d. Eyeball each plot and think about the size of the mean absolute pairwise deviation. One value is clearly the largest, one is clearly the smallest, and two are in between. Which is the largest? The smallest?
e. (Hard) Discuss the scope of inference for these data sets. In particular, what does it tell you if you reject the null hypothesis of no association?
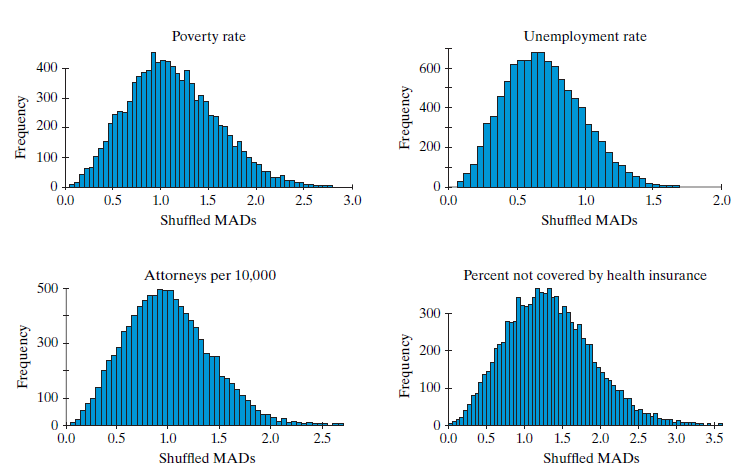
f. The four plots seen in Exercise Figure 9.CE.17(f) show histograms for the simulated null distributions of the mean absolute pairwise difference for the first set of four response variables. Th e observed values of the MAD statistic are 2.8 (poverty), 0.8 (unemployment), 2.0 (attorneys), and 3.8 (not covered). For which variables, if any, do you conclude that there is strong evidence of an association?

g. Use the observed values and histograms from the previous question to match each response variable to its p-value, choosing from 0.00002, 0.0004, 0.03, and 0.33.

Step by Step Answer:

Introduction To Statistical Investigations
ISBN: 9781118172148
1st Edition
Authors: Beth L.Chance, George W.Cobb, Allan J.Rossman Nathan Tintle, Todd Swanson Soma Roy


