

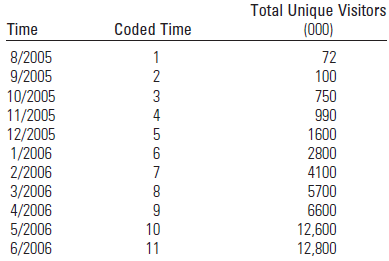
The video-sharing site YouTube attracted 19.6 million visitors in June 2006, an almost 300% increase from January
Question:
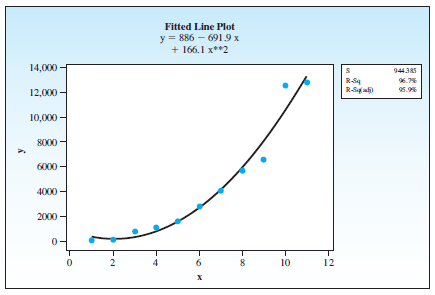
Linear and quadratic fitted plots for these data follow.
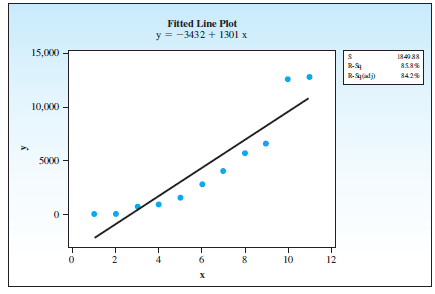
a. Based upon the summary statistics in the line plots, which of the two models better fits the data?
b. Write the equation for the quadratic model.
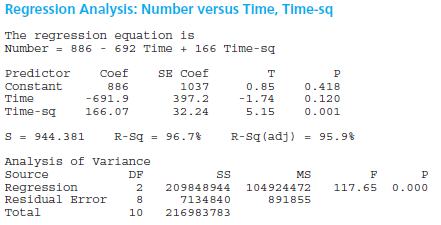
c. Use the following printout to determine if the quadratic term contributes significant information to the prediction of y, in the presence of the linear term.
Fantastic news! We've Found the answer you've been seeking!
Step by Step Answer:
a The values of R 2 adj should be used to compare several different r...View the full answer

Answered By
Kalyan M. Ranwa
I have more than seven years of teaching experience in physics and mechanical engineering.
1+ Reviews
10+ Question Solved
Related Book For 

Introduction To Probability And Statistics
ISBN: 9780495389538
13th Edition
Authors: William Mendenhall, Robert J. Beaver, Barbara M. Beaver
Question Posted:
