

The following analysis was obtained using data in MEAP93, which contains school-level pass rates (as a percent)
Question:
The following analysis was obtained using data in MEAP93, which contains school-level pass rates (as a percent) on a tenth-grade math test.
(i) The variable expend is expenditures per student, in dollars, and math10 is the pass rate on the exam. The following simple regression relates math10 to lexpend = log(expend):
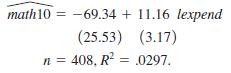
Interpret the coefficient on lexpend. In particular, if expend increases by 10%, what is the estimated percentage point change in math10? What do you make of the large negative intercept estimate? (The minimum value of lexpend is 8.11 and its average value is 8.37.)
(ii) Does the small R-squared in part (i) imply that spending is correlated with other factors affecting math10? Explain. Would you expect the R-squared to be much higher if expenditures were randomly assigned to schools—that is, independent of other school and student characteristics—rather than having the school districts determine spending?
(iii) When log of enrollment and the percent of students eligible for the federal free lunch program are included, the estimated equation becomes
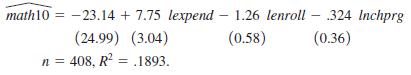
Comment on what happens to the coefficient on lexpend. Is the spending coefficient still statistically different from zero?
(iv) What do you make of the R-squared in part (iii)? What are some other factors that could be used to explain math10 (at the school level)?
Step by Step Answer:
i The coefficient on lexpend represents the estimated change in the response math10 associated with a oneunit increase in the predictor lexpend So in ...View the full answer


Introductory Econometrics A Modern Approach
ISBN: 9781337558860
7th Edition
Authors: Jeffrey Wooldridge
