

The following data are based on information in the 2018 annual report of Cracker Barrel Old Country
Question:
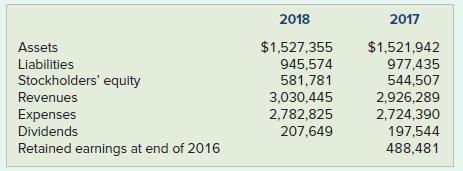
The following data are based on information in the 2018 annual report of Cracker Barrel Old Country Store. As of August 3, 2018, Cracker Barrel operated 655 restaurants and gift shops in 45 states. Dollar amounts are in thousands.
Required
a. Calculate the company’s net income and retained earnings for 2017 and 2018.
b. Which increased (or decreased) by the greatest percentage amount: revenues or net income? Show your computations.
c. For each year, calculate the company’s net income as a percentage of its revenues. Show your computations.
d. Did the company perform better in 2017 or 2018? Explain your answer.
Fantastic news! We've Found the answer you've been seeking!
Step by Step Answer:
Dollar amounts are in thousands a 2017 2018 Revenues 2926...View the full answer

Answered By
Carly Cimino
As a tutor, my focus is to help communicate and break down difficult concepts in a way that allows students greater accessibility and comprehension to their course material. I love helping others develop a sense of personal confidence and curiosity, and I'm looking forward to the chance to interact and work with you professionally and better your academic grades.
12+ Reviews
21+ Question Solved
Related Book For 
Introductory Financial Accounting For Business
ISBN: 9781260575309
2nd Edition
Authors: Thomas Edmonds, Christopher Edmonds, Mark Edmonds, Jennifer Edmonds, Philip Olds
Question Posted:
