

The following table gives the 2015 total payroll (in millions of dollars) and the percentage of games
Question:
The following table gives the 2015 total payroll (in millions of dollars) and the percentage of games won during the 2015 season by each of the National League baseball teams.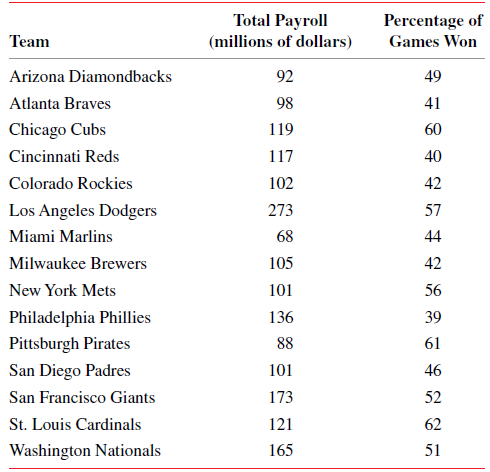
a. Find the least squares regression line with total payroll as the independent variable and percentage of games won as the dependent variable.
b. Is the equation of the regression line obtained in part a the population regression line? Why or why not? Do the values of the y-intercept and the slope of the regression line give A and B or a and b?
c. Give a brief interpretation of the values of the y-intercept and the slope obtained in part a.
d. Predict the percentage of games won by a team with a total payroll of $150 million.
Fantastic news! We've Found the answer you've been seeking!
Step by Step Answer:
Let x total payroll in millions of dollars and y percentage of games won a N 15 x 1859 y 742 ...View the full answer

Answered By
Nimlord Kingori
2023 is my 7th year in academic writing, I have grown to be that tutor who will help raise your grade and better your GPA. At a fraction of the cost on other sites, I will work on your assignment by taking it as mine. I give it all the attention it deserves and ensures you get the grade that I promise. I am well versed in business-related subjects, information technology, Nursing, history, poetry, and statistics. Some software's that I have access to are SPSS and NVIVO. I kindly encourage you to try me; I may be all that you have been seeking, thank you.
360+ Reviews
1070+ Question Solved
Related Book For 

Question Posted:
