The following table gives the average weekly retail price of a gallon of regular gasoline in the
Question:
The following table gives the average weekly retail price of a gallon of regular gasoline in the eastern United States over a 9-week period from December 1, 2014, through January 26, 2015. Consider these 9 weeks as a random sample.
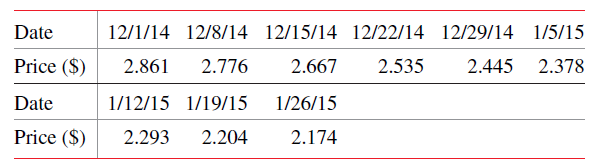
a. Assign a value of 0 to 12/1/14, 1 to 12/8/14, 2 to 12/15/14, and so on. Call this new variable Time. Make a new table with the variables Time and Price.
b. With time as an independent variable and price as the dependent variable, compute SSxx, SSyy, and SSxy.
c. Construct a scatter diagram for these data. Does the scatter diagram exhibit a negative linear relationship between time and price?
d. Find the least squares regression line ŷ = a + bx.
e. Give a brief interpretation of the values of a and b calculated in part d.
f. Compute the correlation coefficient r.
g. Predict the average price of a gallon of regular gasoline in the eastern United States for Time = 26. Comment on this prediction.
Step by Step Answer:
a Let x time and y weekly retail price of a gallon of regular gasoline b n 9 x 36 y 22333 x 2 204 y ...View the full answer