

Describe the trend in the scatterplot of house price and area for some houses. State which point
Question:
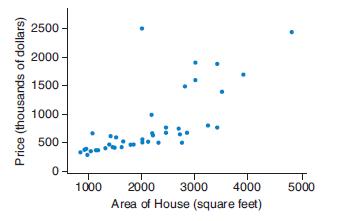
Describe the trend in the scatterplot of house price and area for some houses. State which point appears to be an outlier that does not fit the rest of the data.
Fantastic news! We've Found the answer you've been seeking!
Step by Step Answer:
The scatterplot of house price and area for some hou...View the full answer

Answered By
Ravi Tomar
I have 5 years of experience as an Agricultural Economics tutor. During this time, I have been able to successfully provide guidance to students in their studies and help them develop their knowledge and understanding of the subject. My approach to teaching has always been to combine academic learning with practical application, often drawing on my professional experience to help students better understand how the concepts they learn apply to the real world. I also focus on helping students develop critical thinking skills, enabling them to tackle problems independently and develop their own solutions. I have also been able to provide support on specific assignments, helping students to structure their work and ensure that it meets the required quality and standards.
0 Reviews
10+ Question Solved
Related Book For 

Introductory Statistics Exploring The World Through Data
ISBN: 9780135163146
3rd Edition
Authors: Robert Gould, Rebecca Wong, Colleen N. Ryan
Question Posted:
