

In 2017, the journal Obesity reported on trends in sugar-sweetened beverage (SSB) consumption. A random sample of
Question:
In 2017, the journal Obesity reported on trends in sugar-sweetened beverage (SSB) consumption. A random sample of youths aged 12 to 19 years old were asked to monitor all food and beverages consumed in a 24-hour period. The study was done in 2003 and repeated in 2014. The numbers who consumed a sugary beverage such as soda or fruit juice in a day are shown in the table. (Bleich et al., “Trends in Beverage Consumption among Children and Adults, 2003-2014,” Obesity, vol. 26 [2018]: 432–441. doi:10.1002/oby.22056)
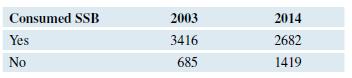
a. Calculate and compare the percentages of youths in this age group who consumed an SSB during the recording period.
b. Check that the conditions for using a two-population confidence interval hold.
c. Find the 95% confidence interval for the difference in the proportion of youth consuming an SSB in 2003 and 2014. Based on your confidence interval, do you think there has been a change in sugar-sweetened beverage consumption among this age group? Explain.
Step by Step Answer:
a Lets first calculate the percentages of youths who consumed an SSB in 2003 and 2014 We can use the following formula percentage frequency sample siz...View the full answer


Introductory Statistics Exploring The World Through Data
ISBN: 9780135163146
3rd Edition
Authors: Robert Gould, Rebecca Wong, Colleen N. Ryan
