

Pew Research conducted a survey in 2017 asking gun owners what percentage of time they had a
Question:
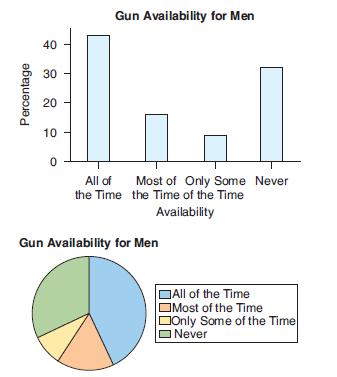
Pew Research conducted a survey in 2017 asking gun owners what percentage of time they had a loaded gun easily within reach when at home. The results for male gun owners are displayed in a bar chart and a pie chart.
a. Which period was the most frequent response?
b. Use the graphs to estimate the difference in the percentage responding “All of the Time” and “Never.” Is this easier to estimate using the bar chart or the pie chart?
Fantastic news! We've Found the answer you've been seeking!
Step by Step Answer:
a The most frequent response was All of the Time with 33 b The differenc...View the full answer

Answered By
Diane Joyce Pastorin
Please accept my enthusiastic application to solutioninn. I would love the opportunity to be a hardworking, passionate member of your tutoring program. As soon as I read the description of the program, I knew I was a well-qualified candidate for the position.
I have extensive tutoring experience in a variety of fields. I have tutored in English as well as Calculus. I have helped students learn to analyze literature, write essays, understand historical events, and graph parabolas. Your program requires that tutors be able to assist students in multiple subjects, and my experience would allow me to do just that.
You also state in your job posting that you require tutors that can work with students of all ages. As a summer camp counselor, I have experience working with preschool and kindergarten-age students. I have also tutored middle school students in reading, as well as college and high school students. Through these tutoring and counseling positions, I have learned how to best teach each age group.
2+ Reviews
10+ Question Solved
Related Book For 

Introductory Statistics Exploring The World Through Data
ISBN: 9780135163146
3rd Edition
Authors: Robert Gould, Rebecca Wong, Colleen N. Ryan
Question Posted:
