

The dotplot shows the number of classes missed in a month for a random sample of 23
Question:
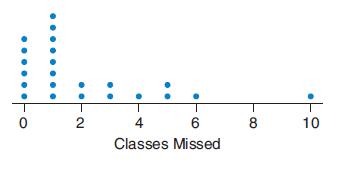
The dotplot shows the number of classes missed in a month for a random sample of 23 students from a private college in California. Explain why you cannot find the geometric mean for the numbers.
Fantastic news! We've Found the answer you've been seeking!
Step by Step Answer:
The dot plot for the number of classes missed in a month by the students ...View the full answer

Answered By
Nikka Ella Clavecillas Udaundo
I have a degree in psychology from Moi University, and I have experience working as a tutor for students in both psychology and other subjects. I am passionate about helping students learn and reach their potential, and I firmly believe that everyone has the ability to succeed if they receive the right support and guidance. I am patient and adaptable, and I will work with each individual student to tailor my teaching methods to their needs and learning style. I am confident in my ability to help students improve their grades and reach their academic goals, and I am excited to work with a new group of students.
0 Reviews
10+ Question Solved
Related Book For 

Introductory Statistics Exploring The World Through Data
ISBN: 9780135163146
3rd Edition
Authors: Robert Gould, Rebecca Wong, Colleen N. Ryan
Question Posted:
