

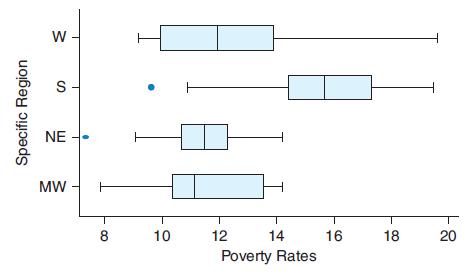
The following boxplot shows the poverty rates (the proportion of the population below the governments official poverty
Question:
The following boxplot shows the poverty rates (the proportion of the population below the government’s official poverty level) for the 50 states and the District of Columbia. The regions are the West (W), South (S), NE (Northeast), and MW (Midwest).
a. List the regions from highest to lowest median poverty rate.
b. List the regions from lowest to highest interquartile range.
c. Do any of the regions have a state with an unusually low or an unusually high poverty rate? Explain.
d. Which region has the least amount of variability in poverty rate? Explain.
e. Why is the interquartile range a better measure of the variability for these data than the range is?
Step by Step Answer:
a The regions from highest to lowest median poverty rate are South S West W Northeast NE ...View the full answer


Introductory Statistics Exploring The World Through Data
ISBN: 9780135163146
3rd Edition
Authors: Robert Gould, Rebecca Wong, Colleen N. Ryan
