

The following dotplots show the number of calories in a sample of cereals from two manufacturers: G
Question:
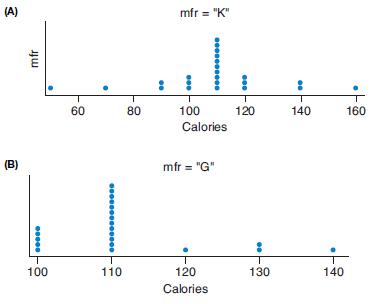
The following dotplots show the number of calories in a sample of cereals from two manufacturers: “G” = General Mills and “K” = Kelloggs.
a. Write a few short sentences that compare the center and the spread for each dotplot.
b. Based on this sample, cereals from which manufacturer tend to have more variation in calories?
Fantastic news! We've Found the answer you've been seeking!
Step by Step Answer:
To compare the center and spread for the two dot plots a Center For manufacturer K the cente...View the full answer

Answered By
Krishnavendra Y
I am a self motivated financial professional knowledgeable in; preparation of financial reports, reconciling and managing accounts, maintaining cash flows, budgets, among other financial reports. I possess strong analytical skills with high attention to detail and accuracy. I am able to act quickly and effectively when dealing with challenging situations. I have the ability to form positive relationships with colleagues and I believe that team work is great key to performance. I always deliver quality, detailed, original (0% plagiarism), well-researched and critically analyzed papers.
4+ Reviews
10+ Question Solved
Related Book For 

Introductory Statistics Exploring The World Through Data
ISBN: 9780135163146
3rd Edition
Authors: Robert Gould, Rebecca Wong, Colleen N. Ryan
Question Posted:
