

The following histogram shows the average ticket prices of 28 Broadway shows in the 2017 season. The
Question:
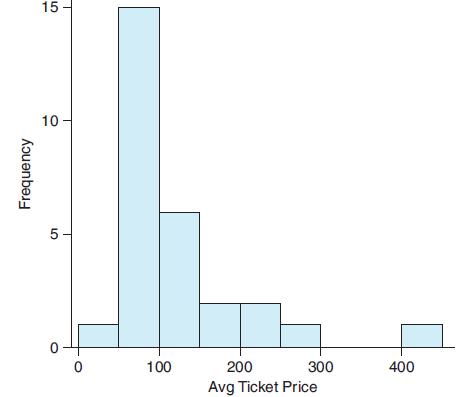
The following histogram shows the average ticket prices of 28 Broadway shows in the 2017 season. The median ticket price was $97.33.
a. Describe the shape of the distribution.
b. Would the mean of the data be greater than, less than, or about the same as the median of the data? Explain.
c. Would a majority of prices be greater than or less than the mean price?
Fantastic news! We've Found the answer you've been seeking!
Step by Step Answer:
a The distribution is positively skewed or skewed to the right b The mean should be gr...View the full answer

Related Book For 

Introductory Statistics Exploring The World Through Data
ISBN: 9780135163146
3rd Edition
Authors: Robert Gould, Rebecca Wong, Colleen N. Ryan
Question Posted:
