

The following histograms show the number of years in office for Democratic and Republican U.S. senators. a.
Question:
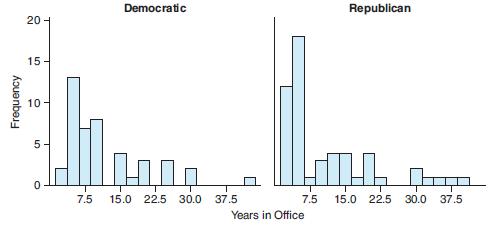
The following histograms show the number of years in office for Democratic and Republican U.S. senators.
a. Describe the shape of each histogram.
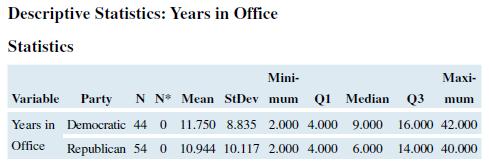
b. Because of the shapes, what measures of center should be compared: the means or the medians?
c. Because of the shapes, what measures of spread should be compared: the standard deviations or the interquartile ranges?
d. Use the appropriate measures to compare the distributions of years in office for the two political parties.
Fantastic news! We've Found the answer you've been seeking!
Step by Step Answer:
a With a few small exceptions the Democratic and Republican histograms are nearly identical overall ...View the full answer

Answered By
Devendra Singh
Hello! My name is Mark Anthony and I am a Licensed Civil Engineer, and my course expertise are on Mathematics, Statistics and Probability, Physics and Civil Engineering. I have also worked as a tutor on a course hero, I help college students answer their questions on that platform. I wanted wanted to share my knowledge and expertise as well on solutionInn
0 Reviews
10+ Question Solved
Related Book For 

Introductory Statistics Exploring The World Through Data
ISBN: 9780135163146
3rd Edition
Authors: Robert Gould, Rebecca Wong, Colleen N. Ryan
Question Posted:
