

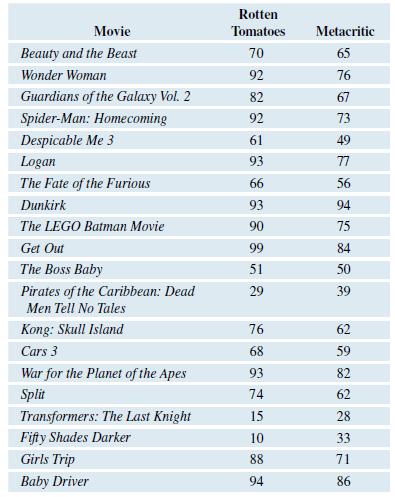
The following table give the Rotten Tomatoes and Metacritic scores for the several movies produced in 2017.
Question:
The following table give the Rotten Tomatoes and Metacritic scores for the several movies produced in 2017. Both of these ratings systems give movies a score using a scale from 0 to 100.
a. Use technology to make a scatterplot using Rotten Tomatoes as the independent variable and Metacritic as the dependent variable. Based on your scatterplot, do you think there is a strong linear association between these variables?
b. Compute the correlation coefficient, r, and write the equation of the regression line. Use the words “Rotten Tomatoes” and “Metacritic” in your equation. Round to two decimal places.
c. Provide an interpretation of the slope of the regression line.
d. Provide an interpretation of the y-intercept of the regression line or explain why it would not be appropriate to do so.
Step by Step Answer:
To address the given questions Ill explain the steps involved and perform the analysis using a Python script which is an example of technology that can be used to create a scatterplot and compute the ...View the full answer


Introductory Statistics Exploring The World Through Data
ISBN: 9780135163146
3rd Edition
Authors: Robert Gould, Rebecca Wong, Colleen N. Ryan
