

The following table shows the average number of vehicles sold in the United States monthly (in millions)
Question:
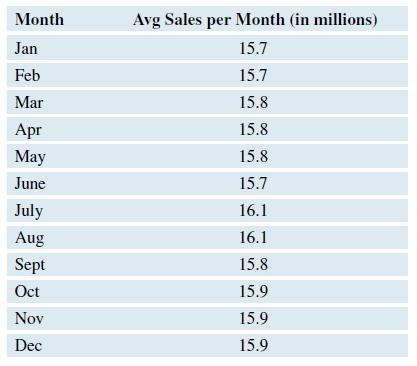
The following table shows the average number of vehicles sold in the United States monthly (in millions) for the years 2001 through 2018. Data on all monthly vehicle sales for these years were obtained and the average number per month was calculated. Would it be appropriate to do a chi-square analysis of this data set to see if vehicle sales are distributed equally among the months of the year? If so, do the analysis. If not, explain why it would be inappropriate to do so.
Fantastic news! We've Found the answer you've been seeking!
Step by Step Answer:
ANSWER A chisquare analysis can be used to test the independence of categorical variables However in this case the data consists of a single variable ...View the full answer

Answered By
Chandrasekhar Karri
I have tutored students in accounting at the high school and college levels. I have developed strong teaching methods, which allow me to effectively explain complex accounting concepts to students. Additionally, I am committed to helping students reach their academic goals and providing them with the necessary tools to succeed.
0 Reviews
10+ Question Solved
Related Book For 

Introductory Statistics Exploring The World Through Data
ISBN: 9780135163146
3rd Edition
Authors: Robert Gould, Rebecca Wong, Colleen N. Ryan
Question Posted:
