

The following table shows the average SAT Math and Critical Reading scores for students in a sample
Question:
The following table shows the average SAT Math and Critical Reading scores for students in a sample of states. A scatterplot for these two variables suggests a linear trend.
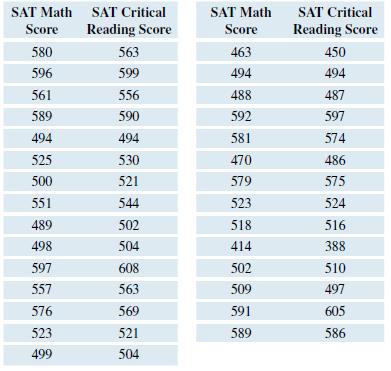
a. Find and report the value for the correlation coefficient and the regression equation for predicting the math score from the critical reading score, rounding off to two decimal places. Then find the predicted math score for a state with a critical reading score of 600.
b. Find and report the value of the correlation coefficient and the regression equation for predicting the critical reading score from the math score. Then find the predicted reading score for a state with a math score of 600.
c. Discuss the effect of changing the choice of dependent and independent variable on the value of r and on the regression equation.
Step by Step Answer:
ANSWER a To find the correlation coefficient and regression equation for predicting the math score from the critical reading score we can use a statis...View the full answer


Introductory Statistics Exploring The World Through Data
ISBN: 9780135163146
3rd Edition
Authors: Robert Gould, Rebecca Wong, Colleen N. Ryan
