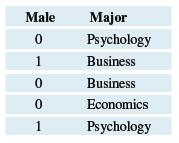
The following table shows the first few entries for the majors of a sample of college students.
Question:
The following table shows the first few entries for the majors of a sample of college students. The data are stacked and coded, where 0 represents a female student and 1 represents a male student. What would be appropriate graphs to compare the distribution of majors for male and female students if you had the complete data set? Explain. Write a statistical question that can be answered with the complete data.
Transcribed Image Text:
Male Major Psychology 1 Business Business Economics 1 Psychology
Fantastic news! We've Found the answer you've been seeking!
Step by Step Answer:
Answer rating: 69% (13 reviews)
A bar graph and a pie chart would be appropriate graphs to compare the distribution of majors ...View the full answer

Answered By

James Warinda
Hi! I’m James Otieno and I'm an experienced professional online tutor with countless hours of success in tutoring many subjects in different disciplines. Specifically, I have handled general management and general business as a tutor in Chegg, Help in Homework and Trans tutor accounts.
I believe that my experience has made me the perfect tutor for students of all ages, so I'm confident I can help you too with finding the solution to your problems. In addition, my approach is compatible with most educational methods and philosophies which means it will be easy for you to find a way in which we can work on things together. In addition, my long experience in the educational field has allowed me to develop a unique approach that is both productive and enjoyable.
I have tutored in course hero for quite some time and was among the top tutors awarded having high helpful rates and reviews. In addition, I have also been lucky enough to be nominated a finalist for the 2nd annual course hero award and the best tutor of the month in may 2022.
I will make sure that any student of yours will have an amazing time at learning with me, because I really care about helping people achieve their goals so if you don't have any worries or concerns whatsoever you should place your trust on me and let me help you get every single thing that you're looking for and more.
In my experience, I have observed that students tend to reach their potential in academics very easily when they are tutored by someone who is extremely dedicated to their academic career not just as a businessman but as a human being in general.
I have successfully tutored many students from different grades and from all sorts of backgrounds, so I'm confident I can help anyone find the solution to their problems and achieve
0.00
0 Reviews
10+ Question Solved
Related Book For 

Introductory Statistics Exploring The World Through Data
ISBN: 9780135163146
3rd Edition
Authors: Robert Gould, Rebecca Wong, Colleen N. Ryan
Question Posted:
Students also viewed these Mathematics questions
-
The following table shows the first few entries for the number of hours of sleep in one night for a sample of college students. The data are stacked and coded, where 0 represents a male student and 1...
-
he table shows the first few entries for the number of hours of television viewed per week for some fifth grade students, stacked and coded, where 1 represents a girl and 0 represents a boy. What...
-
The following table shows the five scores from an Introductory Statistics course. Find a model for final sure to check the conditions for multiple regressions. 2 5 6 3 5 7 2 5 3 10 1 1 9 1 8 8 9 9 0...
-
A chemical processing plant has a network of pipes that are used to transfer liquid chemical products from one part of the plant to another. The following pipe network has pipe flow capacities in...
-
Using the information in Problem 7A, prepare compound closing entries for Plymouth Electronics. Plymouth Electronics Work Sheet For the Year Ended December 31, 2014 Income Statement Dr Balance Sheet...
-
Oxygen can be prepared in the laboratory by heating KClO 3 in the presence of MnO 2 . Write the equation; then determine the mass of KClO 3 needed to produce 0.50 L O 2 gas at 27 C and 755 torr...
-
Consult an issue of a professional journal. Select one specific article and use the ideas of this section to summarize and evaluate the study.
-
Refer to the preceding facts for Parsons acquisition of Solar common stock. Parson uses the simple equity method to account for its investment in Solar. During 2012, Solar sells $30,000 worth of...
-
The following data relate to the operations of Shilow Company, a wholesale distributor of consumer goods: Current assets as of March 31: Cash Accounts receivable Inventory Building and equipment, net...
-
Ajax Investment Company is considering the purchase of land that could be developed into a class A office project. At the present time, Ajax believes that the site could support a 300,000 rentable...
-
The use of the drug Prempro, a combination of two female hormones that many women take after menopause, is called hormone replacement therapy (HRT). In July 2002, a medical article reported the...
-
The following table gives the number of commercial U.S. radio stations for the four most popular formats. Sketch or otherwise create an appropriate graph of the distribution and comment on its...
-
Automotive Accessories needs to borrow $135,000 for 6 months for renovations. It is considering two financing options: Bank Helping Hand offers an 8% annual rate subject to a 10% compensating...
-
sample recipe of a lamb that used one or two the following preparation techniques. Barding Trimming Frenching Portioning Wet and dry marinating Mincing Rolling Tenderising Tying Skewering. You must...
-
A maintenance building construction project also includes an external electrical generator and water tank. The first activity is to excavate which requires two weeks. Following excavation, the...
-
In addition to reading the required resources, review the financial statements for the organization you have selected to find any indication of leasing by that organization. For your initial post,...
-
(a) If the difficulty target for a Bitcoin Proof-of-Work is given by the hash value "0000000000000001F24D00000000000000000000000000000000000000000000", discuss if the following hash value will be...
-
Mark the correct statement about Building right: Select one: a. Building right can not last longer, than 99 years O b. Building right is an obligation - relative right d. Building right arises at the...
-
A solenoid of length 2.8 cm and diameter 0.75 cm is wound with 160 turns per cm. When the current through the solenoid is 0.20 A, what is the magnetic flux through one of the windings of the solenoid?
-
You deposit $10,000 in a savings account that earns 7.5% simple interest per year. What is the minimum number of years you must wait to double your balance? Suppose instead that you deposit the...
-
Answer the questions, using complete sentences. a. What is extrapolation and why is it a bad idea in regression analysis? b. How is the coefficient of determination related to the correlation, and...
-
Some investors use a technique called the Dogs of the Dow to invest. They pick several stocks that are performing poorly from the Dow Jones group (which is a composite of 30 well-known stocks) and...
-
The scatterplot shows the salary and year of first employment for some professors at a college. Explain, in context, what the negative trend shows. Who makes the most and who makes the least? 100....
-
What is the correct depreciation for Denver Region 8 on assets purchased from Magellanic Resources? Keep Only Exclude Regional Office: Denver Region: 8 MACRS Year 1: 0.1429 Purchase Amount: 9,013,421...
-
What measures can be implemented to mitigate the deleterious effects of wealth concentration and income inequality, particularly in an era of globalization?
-
Citation Builders, Incorporated, builds office buildings and single-family homes. The office buildings are constructed under contract with reputable buyers. The homes are constructed in developments...

Study smarter with the SolutionInn App


