

The following table shows the gas tax (in cents per gallon) in each of the southern U.S.
Question:
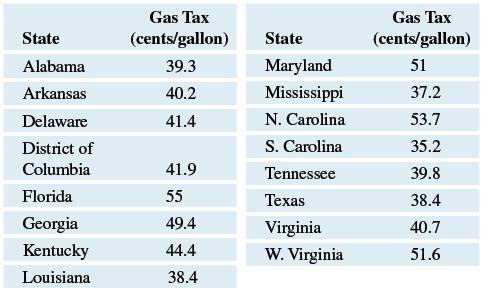
The following table shows the gas tax (in cents per gallon) in each of the southern U.S. states.
a. Find and interpret the median gas tax using a sentence in context.
b. Find and interpret the interquartile range.
c. What is the mean gas tax?
d. Note that the mean for this data set is greater than the median. What does this indicate about the shape of the data? Make a graph of the data and discuss the shape of the data.
Fantastic news! We've Found the answer you've been seeking!
Step by Step Answer:
a The median gas tax for the southern US states is 404 cents per gallon This means that half of the ...View the full answer

Answered By
User l_917591
As a Business Management graduate from Moi University, I had the opportunity to work as a tutor for undergraduate students in the same field. This experience allowed me to apply the theoretical knowledge I had gained in a practical setting, while also honing my teaching and communication skills.
As a tutor, I was responsible for conducting tutorial sessions, grading assignments and exams, and providing feedback and support to my students. I also assisted with the preparation of course materials and collaborated with other tutors and professors to ensure consistency in teaching and assessment.
0 Reviews
10+ Question Solved
Related Book For 

Introductory Statistics Exploring The World Through Data
ISBN: 9780135163146
3rd Edition
Authors: Robert Gould, Rebecca Wong, Colleen N. Ryan
Question Posted:
