

The histogram shown is for pulse rates for 125 people. Convert the vertical axis to relative frequency
Question:
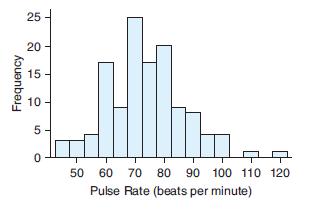
The histogram shown is for pulse rates for 125 people. Convert the vertical axis to relative frequency and show the value that would replace each of the values on the vertical axis.
Fantastic news! We've Found the answer you've been seeking!
Step by Step Answer:
Below is presented the correspondence between frequencies and relative frequencies while t...View the full answer

Answered By
Maria Virtanen
I'm completing my BSc in pure mathematics soon and will continue to MSc in applied mathematics. My strengths are in linear algebra, algebra, and linear programming, but I have great skills in one-variable calculus and geometry, too. In my spare time, I have given some advice in mathematics especially to students in engineering or business studies.
0 Reviews
10+ Question Solved
Related Book For 

Introductory Statistics Exploring The World Through Data
ISBN: 9780135163146
3rd Edition
Authors: Robert Gould, Rebecca Wong, Colleen N. Ryan
Question Posted:
