

The histogram shows the number of runs scored by major league baseball teams for three seasons. The
Question:
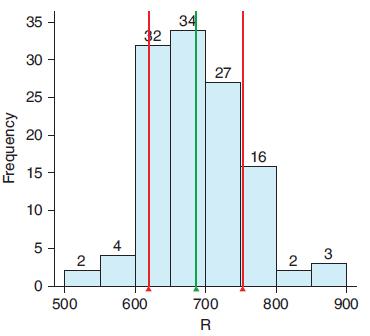
The histogram shows the number of runs scored by major league baseball teams for three seasons. The distribution is roughly unimodal and symmetric, with a mean of 687 and a standard deviation of 66 runs. An interval one standard deviation above and below the mean is marked on the histogram.
a. According to the Empirical Rule, approximately what percent of the data should fall in the interval from 621 to 753 (that is, one standard deviation above and below the mean)?
b. Use the histogram to estimate the actual percent of teams that fall in this interval. How did your estimate compare to the value predicted by the Empirical Rule?
c. Between what two values would you expect to find about 95% of the teams?
Step by Step Answer:
a The Empirical Rule states that roughly 68 of the data should be contained within one standard devi...View the full answer


Introductory Statistics Exploring The World Through Data
ISBN: 9780135163146
3rd Edition
Authors: Robert Gould, Rebecca Wong, Colleen N. Ryan
