

The table shows the Earned Run Average (ERA) and WHIP rating (walks plus hits per inning) for
Question:
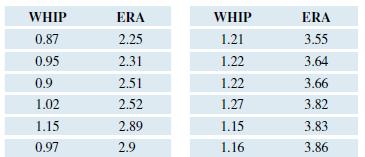
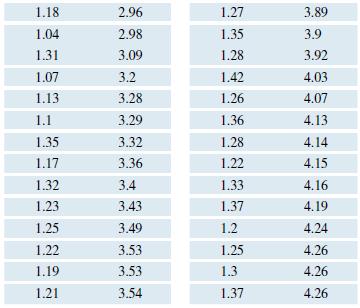
The table shows the Earned Run Average (ERA) and WHIP rating (walks plus hits per inning) for the top 40 Major League Baseball pitchers in the 2017 season. Top pitchers will tend to have low ERA and WHIP ratings.
a. Make a scatterplot of the data and state the sign of the slope from the scatterplot. Use WHIP to predict ERA.
b. Use linear regression to find the equation of the best-fit line. Show the line on the scatterplot using technology or by hand.
c. Interpret the slope.
d. Interpret the y-intercept or explain why it would be inappropriate to do so.
Fantastic news! We've Found the answer you've been seeking!
Step by Step Answer:
Answer a Step 1 To determine Draw a scatterplot and state the sign of the slope Step 2 Answer The sign of the slope is positive Step 3 Explanation The ...View the full answer

Answered By
Sumit kumar
Education details:
QUATERNARY Pursuing M.Tech.(2017-2019) in Electronics and Communication Engg. (VLSI DESIGN) from
GNIOT Greater Noida
TERTIARY B.Tech. (2012-2016) in Electronics and Communication Engg. from GLBITM Greater Noida
SECONDARY Senior Secondary School Examination (Class XII) in 2012 from R.S.S.Inter College, Noida
ELEMENTARY Secondary School Examination (Class X) in 2010 from New R.J.C. Public School ,Noida
CERTIFICATION
Summer Training in ‘WIRELESS EMBEDDED SYSTEM’ from ‘XIONEE’ for the six weeks.
EMBEDDED SYSTEM Certificate issued by CETPA INFOTECH for one day workshop.
Certificate of Faculty development program on OPTICAL COMMUNICATION and NETWORKS for one week.
1+ Reviews
10+ Question Solved
Related Book For 

Introductory Statistics Exploring The World Through Data
ISBN: 9780135163146
3rd Edition
Authors: Robert Gould, Rebecca Wong, Colleen N. Ryan
Question Posted:
