

The table shows the lengths (in miles) of major rivers in North America. (Source: World Almanac and
Question:
The table shows the lengths (in miles) of major rivers in North America. (Source: World Almanac and Book of Facts 2017)
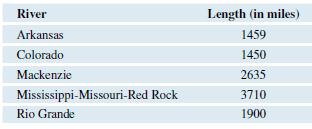
a. Find and interpret (report in context) the mean, rounding to the nearest tenth mile. Be sure to include units for your answer.
b. Find the standard deviation, rounding to the nearest tenth mile. Be sure to include units for your answer. Which river contributes most to the size of the standard deviation? Explain.
c. If the St. Lawrence River (length 800 miles) were included in the data set, explain how the mean and standard deviation from parts (a) and (b) would be affected? Then recalculate these values including the St. Lawrence River to see if your prediction was correct.
Step by Step Answer:
a The mean length of major rivers in North America is 1459 1450 2635 3710 19005 22308 miles This mea...View the full answer


Introductory Statistics Exploring The World Through Data
ISBN: 9780135163146
3rd Edition
Authors: Robert Gould, Rebecca Wong, Colleen N. Ryan
