

The table shows the raw data for the results of a student survey of 22 cars and
Question:
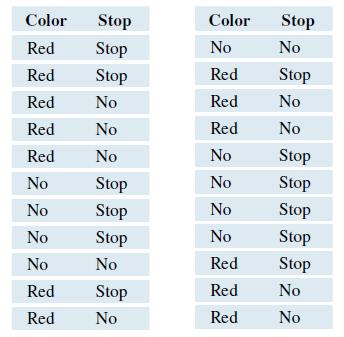
The table shows the raw data for the results of a student survey of 22 cars and whether they stopped completely at a stop sign or not. In the Color column, “Red” means the car was red, and “No” means the car was not red. In the Stop column, “Stop” means the car stopped, and “No” means the car did not stop fully. Create a two-way table to summarize these data. Use Red and No for the columns (across the top) and Stop and No for the rows. (We gave you an orientation of the table so that your answers would be easy to compare.) Are the two variables categorical or numerical?
Fantastic news! We've Found the answer you've been seeking!
Step by Step Answer:
Red No Stop 3 8 No Stop 4 7 The two variables in this case are categorical Color which has t...View the full answer

Answered By
Chandrasekhar Karri
I have tutored students in accounting at the high school and college levels. I have developed strong teaching methods, which allow me to effectively explain complex accounting concepts to students. Additionally, I am committed to helping students reach their academic goals and providing them with the necessary tools to succeed.
0 Reviews
10+ Question Solved
Related Book For 

Introductory Statistics Exploring The World Through Data
ISBN: 9780135163146
3rd Edition
Authors: Robert Gould, Rebecca Wong, Colleen N. Ryan
Question Posted:
